
C# Tip: use Miniprofiler instead of Stopwatch to profile code performance
Just a second! 🫷
If you are here, it means that you are a software developer. So, you know that storage, networking, and domain management have a cost .
If you want to support this blog, please ensure that you have disabled the adblocker for this site. I configured Google AdSense to show as few ADS as possible - I don't want to bother you with lots of ads, but I still need to add some to pay for the resources for my site.
Thank you for your understanding.
- Davide
Do you need to tune up the performance of your code? You can create some StopWatch objects and store the execution times or rely on external libraries like MiniProfiler.
Note: of course, we’re just talking about time duration, and not about memory usage!
How to profile code using Stopwatch
A Stopwatch object acts as a (guess what?) stopwatch.
You can manually make it start and stop, and keep track of the elapsed time:
Stopwatch sw = Stopwatch.StartNew();
DoSomeOperations(100);
var with100 = sw.ElapsedMilliseconds;


sw.Restart();
DoSomeOperations(2000);
var with2000 = sw.ElapsedMilliseconds;

sw.Stop();

Console.WriteLine($"With 100: {with100}ms");
Console.WriteLine($"With 2000: {with2000}ms");
It’s useful, but you have to do it manually. There’s a better choice.
How to profile code using MiniProfiler
A good alternative is MiniProfiler: you can create a MiniProfiler object that holds all the info related to the current code execution. You then can add some Steps, which can have a name, and even nest them.
Finally, you can print the result using RenderPlainText.
MiniProfiler profiler = MiniProfiler.StartNew();

using (profiler.Step("With 100"))
{
    DoSomeOperations(100);
}


using (profiler.Step("With 2000"))
{
    DoSomeOperations(2000);
}

Console.WriteLine(profiler.RenderPlainText());
You won’t anymore stop and start any StopWatch instance.
You can even use inline steps, to profile method execution and store its return value:
var value = profiler.Inline(() => MethodThatReturnsSomething(12), "Get something");
Here I decided to print the result on the Console. You can even create HTML reports, which are quite useful when profiling websites. You can read more here, where I experimented with MiniProfiler in a .NET API project.
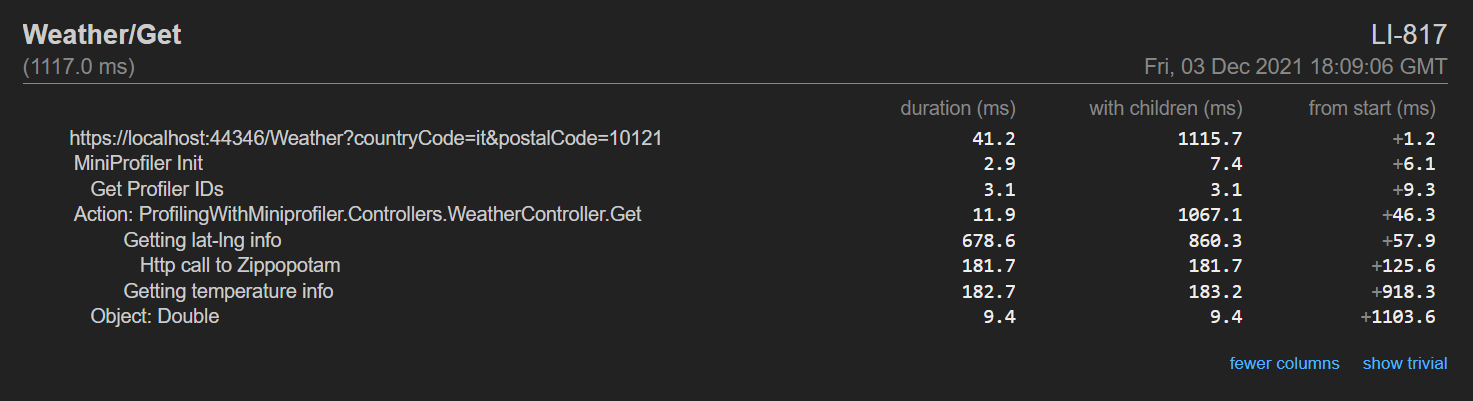
Here’s an example of what you can get:
Further readings
We’ve actually already talked about MiniProfiler in an in-depth article you can find here:
🔗 Profiling .NET code with MiniProfiler | Code4IT
Which, oddly, is almost more detailed than the official documentation, that you can still find here:
🔗 MiniProfiler for .NET | MiniProfiler
Happy coding!
🐧